|
What is Noise?
Noise is a random signal inherent in all physical components. It directly
limits the detection and processing of all information. The common form
of noise is white Gaussian due to the many random processes that make
up electric currents or thermal agitation of conductive elements.
Why is it Important?
Because electronic noise is ubiquitous, present in all passive and
active components, it is critical for engineers to characterize and
understand how it limits the transmission of information.
What does the term Gaussian signify?
The term Gaussian refers to the voltage distribution of the source
of noise. Due to its random nature the noise voltage of a component
is usually a Gaussian distribution. This is characterized by its mean
value and random voltage excursions that follow a bell shaped Gaussian
curve
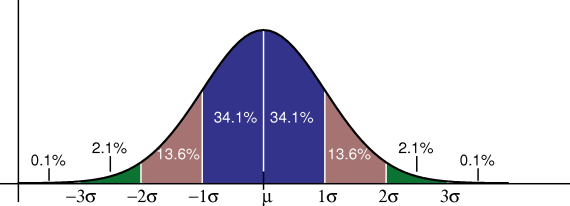
Plot of voltage distribution of noise source µ=0
V
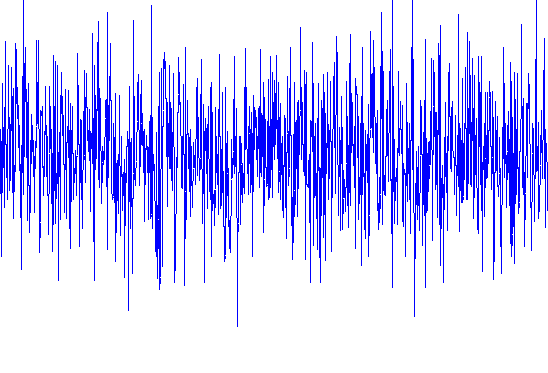
Voltage of noise source versus time
What does the term White signify?
White refers to the noise source power spectral density, which is ideally
flat with frequency. In reality at some point often due to mismatch
there is a reduction in the measurable noise level
What is AWGN?
Additive White Gaussian Noise (AWGN) is a term to refer to the fact
that noise eventually combines with the desired signal and is a major
limiting factor in the transmission of information.
What are the common usages of a noise source?
Noise Sources are used to measure Noise Figure, provide a source of
AWGN to generate CNR or EbNo to measure error rates, and are used as
an economical source of broad band power for built in test applications
such as signal strength calibrators and radar applications . They can
be used to increase the dynamic range of Analog to Digital converters
by dithering and reducing correlated noise. They are often found in
Disk drive testing, wireless testing, CATV both analog and DOCSYS, jamming,
SATCOM for BER and NF, as well employed as a source of jitter.
What types of noise sources are available?
Noise sources can be a simple noise diode which generates a low level
of noise, to amplified noise sources supplied in multiple form factors
to instrumentation grade noise generators which amplify, attenuate and
process both the noise and a user added signal.
Noise diodes come in a variety of packages and
can be surface mount or DIP for PCB mount or coaxial for system integration.
What is ENR?
ENR refers to Excess Noise Ratio which is 10 log {(Th-290)/290}
essentially a normalized measure of how much
the noise source is above thermal in
its power. At high ENRs > 15 dB the density of power can be approximated
by adding the ENR to -174 dBm/Hz.
How are noise sources tested and specified?
Noise sources are typically tested depending on their output level.
Noise Sources that are used in Noise Figure applications are typically
6 to 30 dB in ENR. These usually require a Noise Figure Meter or a dedicated
noise radiometer due to their low power levels. Since the ENR value
is used to calculate the Noise Figure directly low power noise sources
typically are supplied with calibrated ENR values. Higher power noise
sources typically are supplied with aggregate power measurements such
as on a power meter with spectral flatness observed on a spectrum analyzer.
What is the crest factor of a noise source?
Noise Sources are characterized by their crest factor, which is the
peak to average ratio of the noise. For example a 5:1 crest factor of
the noise voltage is 20 log5 =14 dB. This is a measure of the quality
of the noise distributions and one way to measure its Gaussian nature.
Noise theoretically has an unbounded distribution so that it should
have an infinite crest factor but the physical realization of the noise
generator will limit the output excursions, via the amplifiers, diode
junctions etc.
Why and when is crest factor important?
Crest factor is important primarily in Bit Error Rate applications.
In low power applications in which noise powers are being compared such
as NF, it is largely insignificant. In BER applications it is important
because the BER being measured is a direct function of the Carrier to
Noise ratio, and if these noise excursions do not occur as expected
the errors will fall off and the erroneous results will occur. One important
note is that it is the crest factor of the resultant noise in the receiver
and its bandwidth that will determine the resultant crest factor. This
is significant because often times the required noise is a much larger
BW than the receiver, for example a tuned receiver operating over a
wide BW requires the noise to cover the entire RF BW. This can put a
strain on the realizable crest factor because the wide band high power
amplifiers required to cover the entire BW can be cost prohibitive and
degrade system accuracy in other ways such as excess current or reliability.
Since the noise is often filtered in the receiver, the crest factor
of the resultant noise is improved as the excess BW is stripped away
reducing the noise power and leaving the noise farther from the clipping
point. In the limit clipped noise becomes Gaussian as the measurement
BW is reduced. The required crest factor should take into consideration
all of the above.
What is BITE?
BITE stands for Built-In-Test and refers to the utilization of a noise
source as a source of power to test a system. For example the noise
source may be put on a PCB via a TO-8 can, dip package or surface mount
with a coupler or a switch to selectively inject the noise into the
circuit. By turning on the noise source and detecting the system output
power the system can be verified automatically and remotely. The noise
source can also be used to calibrate the receivers noise figure by comparing
its know value to the receiver. Noise temperature, Noise Figure, frequency
response, sensitivity and gain are among the parameters that can be
measured.
What is Eb/No?
Eb/No stands for Energy per bit divided by Noise Density. It is essentially
a normalized Carrier to Noise ratio for digital systems. Typically Eb/No
is plotted versus BER to measure the effectiveness of the information
transfer.
What is CNR?
CNR is Carrier to Noise Ratio and it is the relative power level of
the carrier signal to the noise level in a system. It typically determines
the quality of the system and BER is plotted against CNR. Carrier refers
to the information signal in this case.
What is BER?
Bit error rate is the frequency of errors that occur when bits are
transmitted in a digital system. Critically it is a function of signal
to noise ratio or carrier to noise ratio.
What is Noise Figure?
Noise Figure is defined as the ratio of the signal to noise power at
the input to the signal to noise power at the output of a device, in
other words the degradation of the signal to noise ratio as the signal
passes through the device. Since the input noise level is usually thermal
noise from the source the convention is to adopt a reference temperature
of 290deg K. The noise figure becomes the ratio of the total noise power
output to that portion of the noise power output due to noise at input
when the source is 290 deg K. Hewlett Packard App Note 57-1 describes
these definitions and calculations.
How is noise figure measured and calculated?
Noise figure is typically determined by using a calibrated noise source
which is traceable to international standards. This noise source is
essentially compared to the unknown noise figure and by measuring this
difference noise figure is computed:
NF= ENR dB-10 log (Y-1) + Tcorr
Tcorr is a temperature correction factor that can be applied if the
temperature deviates significantly from 290 K.
Y is the Y factor which is the ratio of the output
power with the noise on to the output power with the noise off . By
employing this method of measuring the Y factor, only relative accuracies
are significant which makes the measurement easier than attempting to
measure exact powers which can be quite low and tough to measure.
How do noise powers add?
Noise powers add as incoherent signals which means that their powers
must be added. For example if your inject a noise source into a spectrum
analyzer and see that the noise floor increases 3 dB, then the actual
noise source power is at the original noise floor level.
This relationship allows you to calculate the noise
power of signals below the measurement noise floor:
10 log [{Inverse log (diff/10)} -1)]
Where diff is the dB difference in measured powers. Of course small
changes in power occur as the unknown noise is far below the known and
this results in increasing inaccuracy as the power goes much lower.
Why cant I see my noise source on a spectrum analyzer?
If you are attempting to measure a lower power noise
source, < 30
dB ENR, in all probability the spectrum analyzer
Noise Figure, which usually is at a minimum of
25 dB and many times is 35 dB, is above the
noise level of noise source. At these levels we
can approximate Noise Figure and ENR and compare
directly to see if the noise source will
be detectable. This source could be measured with
an LNA in front of the Spectrum Analyzer although
to get an exact ENR we would need to
know the NF of the LNA and its gain but we can
see if the approximate deflection occurs. For
example a 15 dB ENR noise source should change
the noise level about 10 dB if the noise figure
of the LNA is about 5 dB, as long as the LNA
gain is sufficient to overcome the Noise figure
of the analyzer.
Higher power noise sources can be measured on a
spectrum analyzer for flatness and on a power meter for output power.
Why test at high power levels?
Sometimes it is convenient to test at higher power levels. For example
BER measurements are a function of Carrier to Noise Ratio and they can
be quite sensitive with large changes in BER resulting with small changes
in CNR. Rather than test at low power levels that are very difficult
to measure, often times it is easier to inject more noise power and
test at levels that are easier to establish what is the actual CNR.
Also often times tests are done at lower CNR so that the BER is higher
and the low BER results are extrapolated, which saves test time because
the errors come so infrequently at high CNR.
What is noise power spectral density?
Typically referred to as No, this is the amount of power the source
will output in a one hertz bandwidth. It is essentially a normalized
output power. Since noise power is proportional to bandwidth, No is
used to compute the power in any bandwidth.
What is -174 dBm/Hz?
This is a convenient number to use, it represents the amount of power
in a one hertz bandwidth that a thermal noise source has at the reference
temperature of 290K, which is close to room temperature. This results
from the equation P= kTB where k= Boltzmanns constant, T is temp in
degrees K and B is the bandwidth. For example the available thermal
noise power in a resistor in a 1 MHz bandwidth would be -114 dBm because
10 log (1MHz) =60 dB is added to the -174 dBm/ Hz.
What is No and how is it used to calculate noise output power?
No is the noise density of the Noise Source. It is the output power
per hertz that the source provides. To calculate the power that the
source will have in a BW the No is added to the dB (BW). For example
a -80 dBm/Hz amplified noise module with 1 GHz BW will have a minimum
of -80 dBm/Hz + 10 log (1 GHz) = -80 dBm/Hz + 90 dB = +10 dBm. If this
source is measured on a spectrum analyzer with the Resolution BW set
to 1 MHz then -80 dBm/Hz + 10 log (1 MHz) = -20 dBm will be displayed.
In actuality the noise source will have some out of band noise and the
resolution BW has a noise equivalent BW greater than its setting so
some adjustment of these numbers will be needed for a more accurate
number. For many applications this first order approximation will suffice.
Aggregate output power should be measured on a power meter, although
it could be approximated by adding 10 log (BWns/RBW) to the number on
the spectral analyzer. Also when performing power calculations on Noise
Sources if the ENR is known the output power density can be approximately
calculated by adding the ENR to -174 dBm/Hz. This is accurate to less
than 0.2 dB at 15 dB ENR and less than .01 dB for ENRs greater than
30 dB. For example a 34 dB ENR noise source would have a noise spectral
density of -174 dBm/Hz + 34 dB = -140 dBm/Hz. In a 10 MHz BW this would
result in -140 dBm/Hz + 70 dB = -70 dBm. For lower ENRs the Th has to
be solved for directly from the definition of ENR then the noise density
10 log kTh would be computed.
Why is Noise Power proportional to BW?
Since noise is a random signal its power is distributed over its usable
bandwidth BW, and the noise source is considered white due to its
constant spectral density. This results in the power measured being
proportional to BW. If a certain power is measured in X BW, then if
the BW is increased to 2X the power measured is double or 3 dB higher.
This should be noted when measuring high level noise sources on a spectrum
analyzer. This is critical because as a systems BW increases to allow
for more information to be processed, this will also introduce more
noise power and reduce the CNR and potentially reduce the dynamic range
of the system. This is a major trade off in all communication systems.
How do I calculate the overall output power of
my noise source?
Use the No Noise density and add 10 log of the BW of the device in
which you wish to measure the noise.
Why is the Bandwidth of the measurement device important ?
Since noise is a distributed broadband signal its power is proportional
to the bandwidth of the measurement device as long as it is in the noise
source frequency range. Higher power noise sources are typically measured
with a power meter that covers greater than the frequency range of the
noise source so all of the power is measured. A true RMS power meter
and sensor should be used, due to the noise sources Gaussian nature
errors can result when diode detectors are used.
How can I measure Noise Figure on a Spectrum analyzer?
Spectrum Analyzers can be used to measure noise figure with a coaxial
calibrated noise source. The DUT is assumed to be an amplifier. The
noise source is connected to drive the amplifier input. On the spectrum
analyzer the noise power is noted at the frequency of interest when
the noise source is on and when it is turned off. This is the Y factor
in dB. Convert the Y factor to linear and plug into the equation NF(dB)=
ENR dB-10 log (y-1). There are various pitfalls to watch out for in
this measurement detailed in the next section.
What are some pitfalls to watch out for with noise measurements on
a spectrum analyzer?
Care must be used when making noise figure measurements on a spectrum
analyzer. There are multiple possible sources of potential error. Since
noise sources are very broadband their powers can increase quickly as
gain is added. Couple this with the fact that the noise has large peaks
that can start to compress the amplifier and the high noise figure of
spectrum analyzers results in less range available then one might think.
For example suppose a 2-18 GHz LNA with 20 dB gain and a 0 dBm P1 dB
is to be measured with a 25 dB ENR 2 to 18 GHz noise source. If the
expected noise figure is 5 dB then the output noise is approximately
25 dB above thermal with the noise source off. The spectrum analyzer
may have a noise marker mode that will display the No directly. If not
it can be approximated by taking 10 log of the Resolution BW and subtracting
this from the measured noise power. If the spectrum analyzer noise floor
is -144 dBm/Hz then this is approximately a 30 dB noise figure (The
spectrum analyzer noise floor can be reduced by pulling out attenuation
however if 0 dB is used then care must be exercised because the VSWR
will be degraded, if the broad band response is very ripple then additional
errors can be introduced). We can see that the output noise is below
the analyzer noise floor by about 5 dB. This will give some deflection
perhaps about 1.2 dB. This will result in a direct error in the noise
figure and even if it is compensated for, small changes in the spectrum
analyzer will result in large swings in the computed noise figure. This
can also be analyzed by Noise Figure second stage equations to see the
increase in expected noise figure.
Typically a preamp can be added to the spectrum input, in this case
assume that another similar amplifier is added. The net noise power
into the analyzer is now 5 + 20 +20 = 45 dB above thermal which is -174
dBm + 45 dB = -129 dBm/ Hz. Since this is now 15 dB away from the spectrum
analyzer noise floor we should be operating in a proper range. Now though
we must check the high end. When the noise source is on, the approximate
output power will be -174dBm/Hz + 65 dB which is -109 dBm/Hz. The aggregate
power out of the amplifier is then -109 dBm/Hz + 10 log (18 GHz) = -
7dBm. This is too close to the P1dB of the preamp as it will begin to
compress the amplifier, which due to the large peaks of the noise which
will effectively reduce the head room to less than this 7 dB difference.
In this case a preamp with at least +10 dBm P1dB would be needed, or
a noise source of 15 dB would be a better selection because the relative
differences in the Y factor are reduced, resulting in less stress on
the measurement system. Also the power into the spectrum analyzer should
be noted as this can compress the analyzer response also.
This example is meant to demonstrate the potential care that must be
used for this measurement, all these possible errors can be accounted
for and various analyzers do some of this but if the operator is not
aware noise figure errors can result which may not always be easy to
detect.
What are some useful conversions?
Output Power (dBm) = No + 10 Log (BW)
No = -174 + ENR for ENRs > 15 dB
No= Output Power(dBm) 10 Log (BW)
What type of noise source should I choose for my
application.?
If you are attempting to make a noise figure measurement typically
you should choose a calibrated coaxial noise source, with either 6,
15 or 30 dB ENR . This will allow you to measure Noise Figure using
the cal points provided with a noise figure meter or a spectrum analyzer.
15 dB is the most common as it can comfortably measure high and low
noise figures. Very low noise figures can use a 6 dB source which will
have reduced VSWR uncertainty and reduced Y factors. 30 dB sources are
used in high noise figure applications or when the noise maybe injected
via a coupler, or high loss device.
If you are looking to make BER measurements typically you would want
to choose a higher power noise source like an amplified module or an
instrument. This will allow you to set Carrier to Noise Ratios easier.
Although it can be done with a low power noise source the measurement
is difficult at these low powers. Since the BER depends primarily on
the ratio of the Carrier to Noise, typically the CNR is set at higher
powers with a power meter and a calibrated filter or by measuring on
a spectrum analyzer.
If you have any additional questions about noise,
please do not hesitate to ask us at NoiseWave!
|